Dashboard
The Dashboard is the main screen that opens after sign-in. It has two tabs:
| Tab | Shows |
|---|---|
| Live Sessions | A summary of the users connected right now. |
| Connection History | Completed connections. |
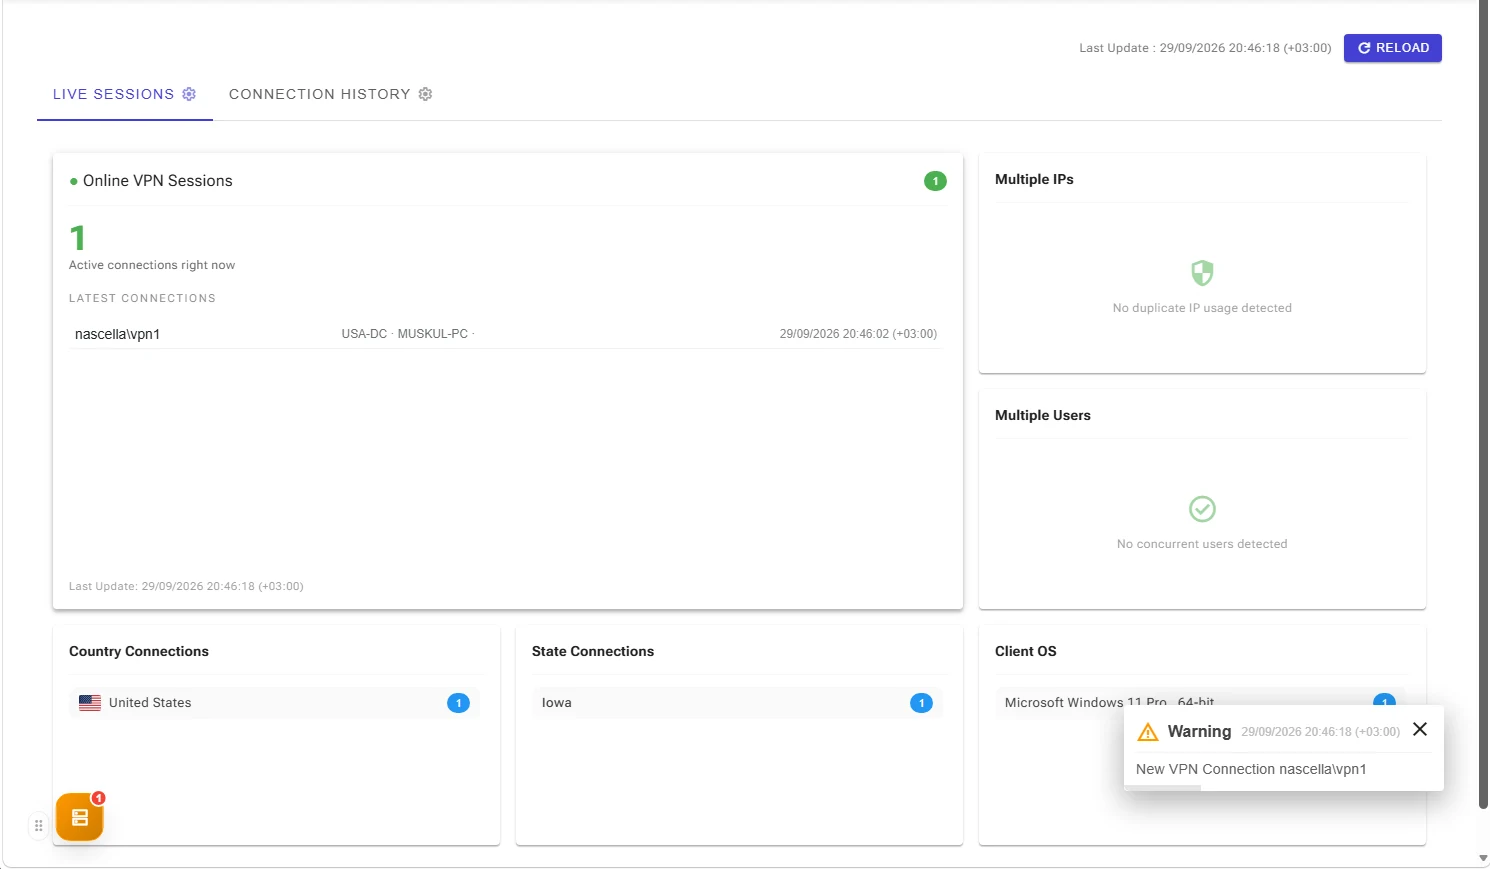
The screen refreshes itself every minute; click Reload at the top right to refresh immediately. When a new VPN connection starts, a notification appears at the bottom right.
Live sessions
| Widget | Shows |
|---|---|
| Online VPN Sessions | Number of users connected right now and the latest connections (user, site, device, time). |
| Multiple IPs | Repeated use of the same IP address. |
| Multiple Users | Users connected concurrently. |
| Country Connections / State Connections | Countries and regions connections come from (requires GeoIP). |
| Client OS | Operating systems of the connecting devices. |
Connection history
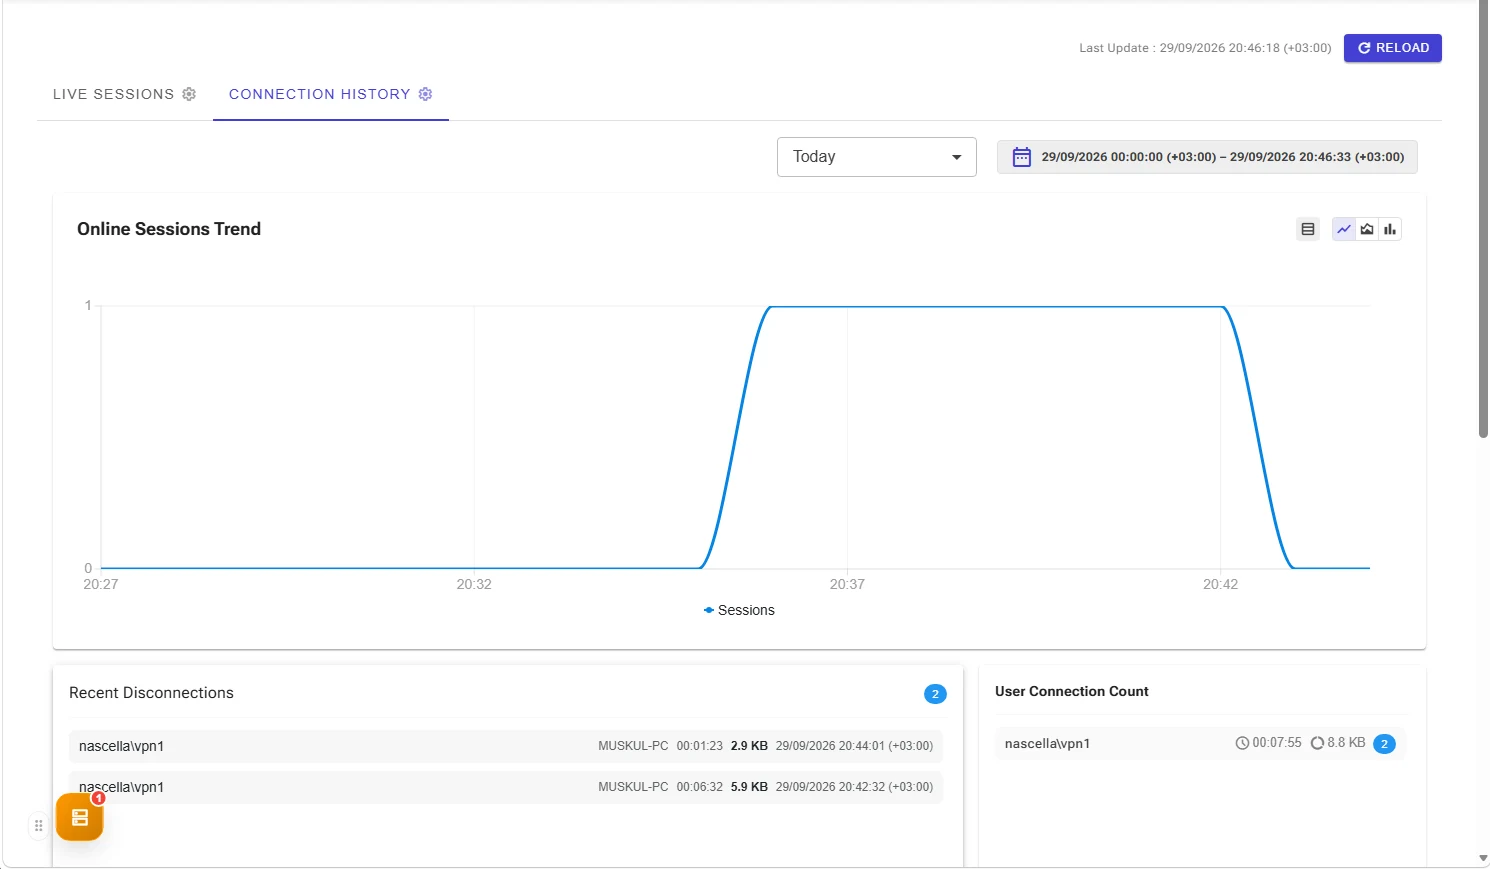
The Connection History tab shows completed connections for the selected time range. Choose a range such as Today from the list, or pick exact start and end times with the date selector next to it.
- Online Sessions Trend shows how many users were connected over time. Use the buttons at the top right of the widget to switch between line, area and bar charts or to view the data as a table.
- Recent Disconnections lists the latest sessions with the device, duration and traffic volume.
- User Connection Count shows each user's number of connections, total duration and traffic.
Arrange the dashboard
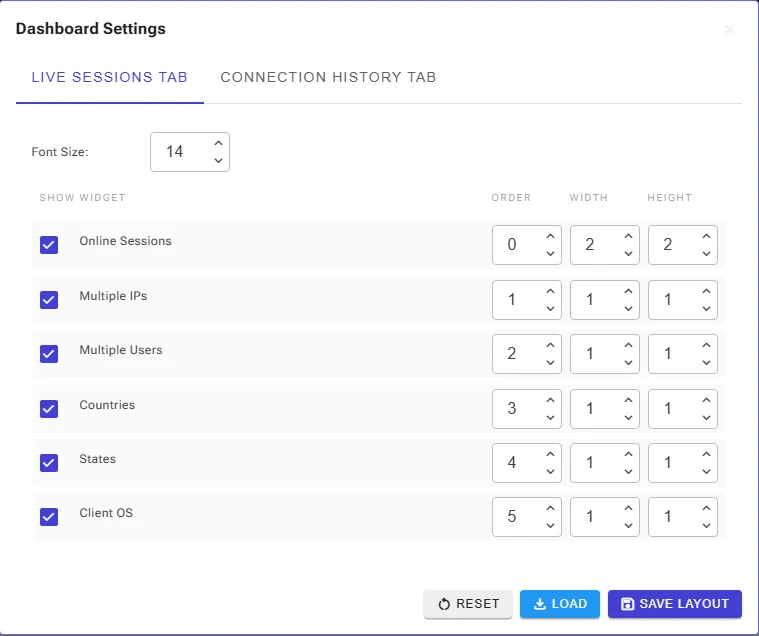
Click the gear icon next to a tab name to open Dashboard Settings. Each tab has its own settings.
- Font Size: text size inside the widgets.
- Show widget: clear the box to remove a widget from the dashboard.
- Order, Width, Height: position and size of the widget.
- Save Layout saves your layout, Load restores the saved layout and Reset returns to the default.
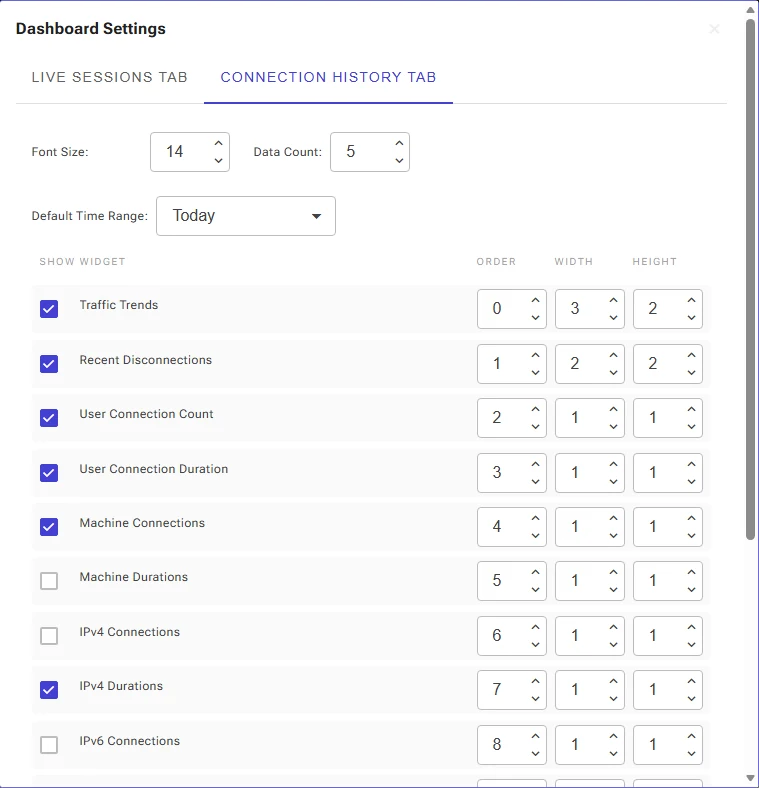
On the Connection History tab you also set how many records the widgets show (Data Count) and which time range is selected when the tab opens (Default Time Range, for example Today). This tab has widgets for traffic trends, recent disconnections, per-user and per-machine connection counts and durations, IPv4/IPv6 and country/region.